Event-Asset Probability Graph
What It Is
The Probability Graph is not a system we build and deploy. It is what emerges from the Data Layer and Inference Engine running continuously over time.
Every time an event occurs, the inference engine makes a judgment. Then the market gives a result. That event-judgment-outcome triplet becomes a data point that calibrates the graph. Over weeks and months, the graph accumulates thousands of calibrated relationships between event types and asset impacts.
Data Layer (events) → Inference Engine (judgments) → Probability Graph (calibration)
        ↑                                                      |
        └──────────── Market outcomes feed back ←───────────────┘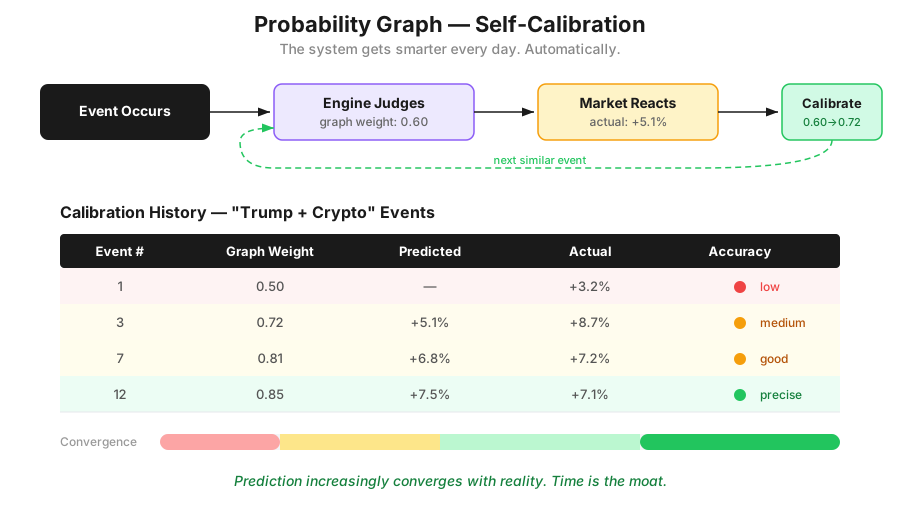
How It Works
The graph is a data structure where:
- Nodes = event types + assets + market states
- Edges = probabilistic impact relationships (direction + strength + historical calibration)
When a new event enters the system, the inference engine classifies it by type, then queries the graph — a millisecond-level graph lookup, not an LLM call — to retrieve all historically calibrated impact relationships.
Example Graph State
After months of operation, the graph might contain:
| Event Type | Asset | Correlation | Historical Avg. Impact | Calibration Events |
|---|---|---|---|---|
| Fed Rate Cut | BTC | Positive 0.85 | +8.2% | 12 |
| Fed Rate Cut | ETH | Positive 0.79 | +9.1% | 12 |
| Fed Rate Cut | SOL | Positive 0.62 | +11.3% | 8 |
| Exchange Hack | Affected Token | Negative 0.95 | -23% | 6 |
| Exchange Hack | DEX Tokens | Positive 0.58 | +12% | 4 |
| Crypto-Friendly Legislation | BTC | Positive 0.78 | +6.5% | 9 |
| Crypto-Friendly Legislation | DeFi | Positive 0.71 | +12.3% | 7 |
Self-Calibration
The graph doesn't just store static relationships — it calibrates itself with every event-outcome pair.
Calibration Example: "Trump + Crypto" Events
| Event # | Graph Weight | Predicted | Actual | Accuracy |
|---|---|---|---|---|
| 1 | 0.50 | — | +3.2% | Low |
| 2 | 0.60 | +3.2% | +5.1% | Low |
| 3 | 0.72 | +5.1% | +8.7% | Medium |
| 7 | 0.81 | +6.8% | +7.2% | Good |
| 12 | 0.85 | +7.5% | +7.1% | Precise |
With each event, the prediction converges closer to reality. By event #12, the graph predicts within 0.4% of the actual outcome.
Three-Dimensional Calibration
Most systems — if they attempt probability calibration at all — calibrate from a single data source. Roma calibrates from three:
| Calibration Source | What It Provides |
|---|---|
| Roma News | Event occurrence and classification |
| Roma Predict | Market-implied probability (Polymarket odds) |
| Roma Perp | Actual price outcome (Hyperliquid) |
This three-dimensional calibration is structurally more accurate than single-source calibration. The prediction market provides an independent probability estimate that can be compared against both the news-based judgment and the actual outcome.
Why This Is a Moat
The Probability Graph has three properties that make it defensible:
1. Time Barrier
Graph accuracy depends on the number of event-outcome pairs processed. A new entrant starting today needs the same months of operation to accumulate comparable calibration data. The architecture can be copied. The data cannot.
2. Compound Growth
Every event processed makes the graph smarter. This is not a system that degrades or requires manual maintenance — it improves automatically, every day.
3. Discovery
The graph doesn't just refine known relationships — it discovers new ones. When "Trump signs crypto executive order" causes AI tokens to rally, the graph automatically adds that previously unknown correlation. Over time, the graph maps relationships that no human analyst has identified.
Graph Lookup Speed
When a new event is classified, querying the graph for all related assets and their impact probabilities takes < 5 milliseconds. This is a graph traversal, not an LLM inference — making it fast enough for real-time trading decisions.